The solar payback period in cloudy climates is less about weather and more about a series of quantifiable engineering and financial decisions made before installation.
- System performance hinges on total annual energy (insolation), not just sunny days, with modern panels retaining significant output under cloud cover.
- Financial viability is determined by pre-installation analysis of shade impact, roof longevity, and your home’s specific energy baseload.
Recommendation: Before requesting quotes, perform a detailed shade assessment and analyze your smart meter data to establish a precise energy baseline; this will have a greater impact on your ROI than local weather patterns.
For homeowners in perpetually overcast regions like the UK, Seattle, or Northern Europe, the idea of solar power can feel like a paradox. The common wisdom suggests a direct relationship between sunshine and savings, leading to a logical question: is investing in solar a sound financial decision when blue skies are a rare commodity? Many articles offer a simple “yes,” followed by the vague reassurance that the payback period will just be a bit longer. This oversimplification misses the point entirely and is a disservice to anyone considering a significant capital investment.
The truth is, determining the financial viability of solar in a low-sunlight environment is not a matter of guesswork; it’s a feasibility study. It’s an engineering problem with specific, quantifiable variables. The calculation goes far beyond simply counting sunny days. It involves modeling the real-world impact of diffuse light, accurately assessing energy losses from shade, understanding the critical timing of roof replacement, and leveraging financial instruments like Time-of-Use (TOU) electricity rates to your advantage. Your payback period is not a passive outcome of your climate; it’s an active result of your pre-installation strategy.
This analysis will guide you through that engineering mindset. We will deconstruct the key factors that truly define your solar return on investment, moving past the weather to focus on the variables you can actually control. From the physics of power generation on a grey day to the hard math of purchase models and the crucial first step of analyzing your own consumption, you will learn how to calculate a realistic payback period grounded in data, not just hope.
To navigate this detailed analysis, we have broken down the core components that determine a solar system’s true financial performance in less-than-ideal climates. The following sections will equip you with a step-by-step framework for evaluating your own solar potential from an engineer’s perspective.
Summary: Calculating the True ROI of Solar in Overcast Regions
- Why Do Solar Panels Still Generate 20% Power on Overcast Days?
- How to Check if Your Neighbor’s Tree Kills Your Solar Potential?
- PPA vs. Cash Purchase: Which Yields Better Long-Term Savings?
- The Re-Roofing Nightmare: Why You Must Replace Shingles Before Installing Solar?
- When to Add a Battery: Is Storage Worth It Without Frequent Blackouts?
- Why Does Running Your Dryer at 6 PM Cost Twice as Much?
- Why Do 80% of Recycled Electronics Still End Up in Landfills?
- How to Lower Your Utility Bill by 15% Using Smart Meter Data?
Why Do Solar Panels Still Generate 20% Power on Overcast Days?
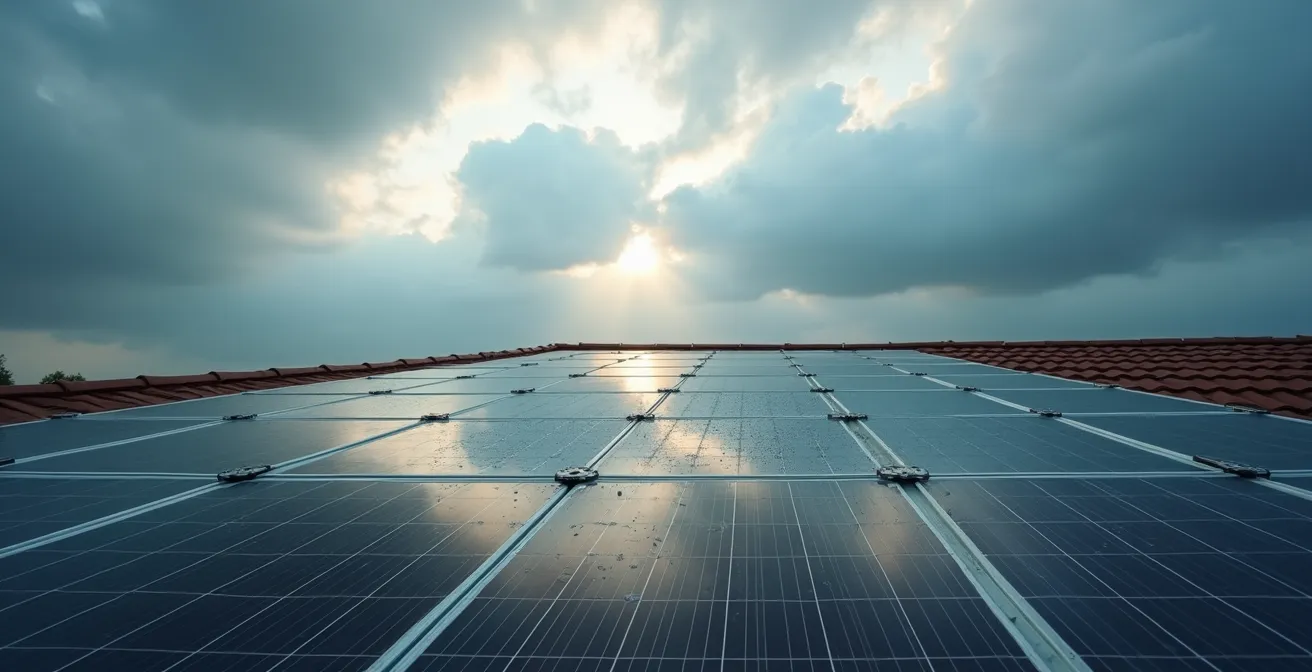
The most common misconception about solar is that panels require direct, unobscured sunlight to function. In reality, photovoltaic (PV) cells are engineered to capture photons from two primary types of light: direct irradiance (sunbeams) and diffuse irradiance (scattered light). On an overcast day, clouds scatter sunlight, bathing the environment in this diffuse light. While less intense, it still carries enough energy for panels to generate a significant amount of electricity. High-quality panels can often produce 10-25% of their rated output even on a heavily overcast day.
The performance drop is not a complete shutdown. Research from the University of Port Harcourt quantifies this, showing an average 23.8% power loss with light clouds and a 66.75% loss with heavy cloud cover. This means even in the worst conditions, you are still capturing a third of the potential energy. This is why total annual energy production, or insolation (kWh/m²/year), is a more critical metric for payback calculations than the simple number of “sunny days.”
This principle is proven by real-world data from notoriously cloudy regions. A comprehensive study of 55,000 residential solar installations across the UK found that they achieved, on average, 85% of their predicted energy output, confirming the reliability of modern modeling. Similarly, data from 8MSolar shows that installations in Seattle produce an average of 1,000 kWh per kW installed. While this is less than the 1,550 kWh generated in sunny Miami, it is a testament to the technology’s effectiveness, especially considering Seattle has 58% fewer sunny days. The key takeaway is that consistent, albeit lower, production on cloudy days contributes substantially to the annual total, making solar a viable investment based on a year-long generation curve, not just peak summer performance.
How to Check if Your Neighbor’s Tree Kills Your Solar Potential?
While panels can handle clouds, partial or complete shading from a fixed object like a tree or adjacent building is a far more significant threat to your system’s output and financial return. A string inverter system, where panels are wired in series like old Christmas lights, is particularly vulnerable. If even one panel is shaded, the output of the entire string can plummet by 30-40% or more. This is where a precise, pre-installation shade analysis becomes the most critical step in your feasibility study.
The solution to shade-related losses often lies in hardware selection. Module-Level Power Electronics (MLPEs), such as microinverters or DC power optimizers, isolate the performance of each panel. If one panel is shaded, the others continue to produce at their maximum capacity. This technology is not just a marginal improvement; California studies demonstrate a 5-10% energy output increase with microinverters in moderately shaded conditions compared to string inverters. For a home in a leafy suburb, this difference can shorten a payback period by a year or more, easily justifying the higher upfront cost of MLPEs.
Before you even speak to an installer, you must become your own shade analyst. Guesswork is not an option. You need to map the sun’s path across your roof throughout the year and quantify the exact percentage of potential generation lost to obstructions. This data will directly inform your system design and financial projections.
Your 5-Point Shade Assessment Plan
- Seasonal Documentation: Use a camera to take time-lapse photos of your roof from a fixed position, documenting shade patterns hourly from 9 AM to 5 PM during the spring, summer, autumn, and winter solstices.
- 3D Obstruction Modeling: Utilize free online LIDAR viewers (if data is available for your area) to create a 3D model of your home and surrounding trees or buildings to visualize shadow paths.
- Calculate Shade Impact: Employ a solar pathfinder tool or a specialized smartphone app (like Sun Seeker) to measure the angular obstruction and calculate the percentage of “peak sun hours” lost to shade.
- Financial Impact Analysis: Compare the projected financial loss from a string inverter (assume a 40% loss for any shaded period) versus a microinverter system (assume a 5% loss) based on your shade percentage.
- Legal Due Diligence: Research your local municipality’s “Solar Access Rights” or easement laws. Understanding your legal recourse if a neighbor’s future construction or tree growth impacts your system is a crucial risk-mitigation step.
PPA vs. Cash Purchase: Which Yields Better Long-Term Savings?
Once you’ve confirmed your property has viable solar potential, the next critical decision is the financing model. The two most common paths are a direct cash purchase (or loan) and a Power Purchase Agreement (PPA), and they have vastly different impacts on your long-term return on investment. A PPA, often marketed as “$0 down solar,” is essentially a rental agreement. A solar company installs panels on your roof at no upfront cost, and you agree to buy the power they generate at a fixed rate, which is typically 10-20% below your utility’s current rate. You don’t own the system; you’re just a tenant on your own roof.
A cash purchase, while requiring significant upfront capital, means you own the asset outright. This entitles you to the full financial benefits, most notably the 30% federal tax credit in the U.S. and any local incentives. With a PPA, the solar company claims those valuable credits, not you. Furthermore, PPA agreements almost always include an “escalator” clause, meaning the price you pay per kWh increases annually, often by around 2.9%. This can erode your savings over time, especially if utility rates don’t rise as quickly.
A cash purchase offers a clear payback period, after which the electricity is virtually free for the remaining life of the system. A PPA has no payback period because you never own the system; you are simply locked into a 20-25 year contract of paying a slightly lower electricity bill. As a case study from Wisconsin shows, even in a cold, snowy climate, cash-purchased systems can have a payback period of 5-9 years for a professional installation, unlocking two decades of free electricity. The complexity of transferring a PPA during a home sale can also be a significant deterrent for potential buyers, whereas an owned system demonstrably increases property value.
The following table, based on an analysis of solar financing options, breaks down the core financial differences:
| Financial Aspect | Cash Purchase | PPA Agreement |
|---|---|---|
| Upfront Cost | $12,000-$20,000 after incentives | $0 |
| Tax Credit Recipient | Homeowner (30% federal) | Solar Company |
| Typical Escalator | N/A | 2.9% annually |
| Payback Period | 6-10 years average | No payback (rental model) |
| 25-Year Savings | $20,000-$97,000 | 10-20% utility savings |
| Home Sale Impact | Increases property value | Transfer complexity |
| System Ownership | Full ownership | No ownership |
The Re-Roofing Nightmare: Why You Must Replace Shingles Before Installing Solar?
One of the most catastrophic and completely avoidable financial pitfalls in a solar project is failing to assess the health of your roof before installation. Solar panels have a warrantied lifespan of 25 years, while a standard asphalt shingle roof lasts about 20-30 years. If your roof is already 15 years old, its end-of-life will likely occur mid-way through your solar panels’ productive years. This creates a costly logistical nightmare.
Replacing a roof with an existing solar array is not a simple task. It requires a specialized crew to decommission the system, carefully remove and store the panels and racking, coordinate with roofers for the shingle replacement, and then re-install and re-commission the entire solar system. This complex process is expensive; the cost for the removal and re-installation of the panels alone can be staggering. Industry data indicates that a mid-life re-roofing under existing solar panels can equal 30-50% of the original system’s cost. This unforeseen expense can single-handedly derail your payback calculations, adding years to the timeline or erasing your projected savings entirely.

Therefore, a roof health audit is a non-negotiable prerequisite. If your roof has less than 15 years of remaining life, the most financially prudent decision is to replace it *before* installing solar. While this adds to the upfront project cost, it synchronizes the lifespan of your roof and your solar system, preventing a massive, predictable expense down the line and ensuring the integrity of your entire investment. Before contacting a solar installer, perform a thorough self-inspection using these key indicators:
- Granule Loss: Check your gutters for an accumulation of asphalt granules, a primary sign that your shingles are degrading.
- Curled or Cracked Shingles: Visually inspect the roof, paying close attention to edges and valleys where shingles are most prone to curling, cracking, or breaking.
- Attic Inspection: From inside your attic on a sunny day, look for any daylight penetrating the roof deck. Also, inspect the underside for moisture stains or dark spots, which indicate past or current leaks.
- Roof Age Verification: Confirm the age of your roof against the manufacturer’s warranty. If it’s more than halfway through its warrantied life, replacement should be seriously considered.
- Existing Layers: Check the edge of the roof to see how many layers of shingles are present. Most building codes allow a maximum of two layers; if you already have two, a complete tear-off and replacement is required.
When to Add a Battery: Is Storage Worth It Without Frequent Blackouts?
For many homeowners, the primary motivation for adding a battery to a solar system is backup power during grid outages. In cloudy climates with stable grids, where blackouts are infrequent, this value proposition is weak. However, framing a battery solely as an insurance policy ignores its most powerful function in a modern energy market: Time-of-Use (TOU) arbitrage. This is the key to making a battery financially viable even without blackouts.
Many utilities are shifting to TOU rate plans, where the price of electricity changes throughout the day. Power can cost two to three times more during “peak” hours (e.g., 4-9 PM) than during “off-peak” hours. A solar battery allows you to exploit this price difference. You can store the “free” energy your panels generate during the day and discharge it during the expensive peak evening hours, avoiding high utility charges. This act of “buying low” (charging with solar) and “selling high” (offsetting peak rates) is a direct, daily return on your battery investment.
However, this calculation isn’t without its own engineering constraints. Batteries are not a perfect vessel for energy. Every time you charge and discharge a battery, some energy is lost. This is known as round-trip efficiency. According to EcoFlow, even modern solar batteries achieve only 85-90% round-trip efficiency. This means for every 10 kWh you store, you can only retrieve 8.5-9.0 kWh. This loss must be factored into your TOU savings calculations to determine the true payback period of the battery itself, which often ranges from 8 to 12 years.
The strategy in a cloudy climate, as highlighted by Sunrun, is often to oversize the solar array by 25-35% to ensure enough surplus energy is generated even on grey days to fully charge the battery. This stored power can then be used to ride out subsequent cloudy periods or, more importantly, to maximize savings through TOU arbitrage. The battery’s value is not in the one or two times a year the power goes out, but in the 365 days a year you can actively manage your exposure to volatile electricity pricing.
Why Does Running Your Dryer at 6 PM Cost Twice as Much?
The question of why running an appliance at 6 PM costs more than at 11 PM goes to the heart of modern utility pricing and is the central reason why solar-plus-storage is becoming financially viable. The cost of electricity is not static; it’s driven by supply and demand. Demand for electricity surges in the late afternoon and early evening as people return from work, turn on lights, cook dinner, and run appliances. This period, typically from 4 PM to 9 PM, is known as the “peak demand” window.
To meet this high demand, utilities have to fire up additional, often less efficient and more expensive, “peaker” power plants. To discourage usage during this strain on the grid and to cover these higher generation costs, they implement Time-of-Use (TOU) rates. Under a TOU plan, the price per kilowatt-hour (kWh) can be dramatically different depending on the time of day. Running a high-draw appliance like an electric dryer or charging an EV during this peak window can easily cost double or triple the price of running it overnight during “off-peak” hours.
This pricing structure creates a clear financial strategy for homeowners. The goal is to shift as much energy consumption as possible away from the expensive peak period. Without solar, this means waiting until late at night to run dishwashers or laundry. With a solar and battery system, you have a more powerful tool: you can use your stored solar energy to power your home through the entire peak window, effectively making yourself immune to the highest rates your utility charges. This practice of “load shifting” is where the most significant daily savings are realized.
The following table, based on data from EnergySage, illustrates a typical TOU rate structure and the corresponding strategy for a home with solar and battery storage.
| Time Period | Rate Type | Typical Cost/kWh | Solar+Battery Strategy |
|---|---|---|---|
| 4-9 PM | Peak | $0.30-$0.45 | Discharge battery |
| 9 PM-9 AM | Off-Peak | $0.10-0.15 | Grid usage/charging |
| 9 AM-4 PM | Mid-Peak | $0.20-$0.25 | Solar production/battery charge |
| Weekends | Variable | $0.15-0.20 | Optimize based on production |
Key Takeaways
- Financial viability in cloudy climates depends on total annual insolation and diffuse light capture, not just the number of sunny days.
- The most critical factors impacting ROI are pre-installation analyses of shade, roof health, and your home’s energy baseload, all of which are within your control.
- Maximizing savings involves strategic hardware choices (e.g., microinverters for shade) and financial tactics like using a battery for Time-of-Use arbitrage, not just for backup.
Why Do 80% of Recycled Electronics Still End Up in Landfills?
The provocative statistic that much of our e-waste isn’t properly recycled raises a valid long-term question for prospective solar owners: are solar panels just another piece of electronics destined for a landfill in 25 years? This concern touches on both the environmental and long-term financial case for solar. If a panel’s value drops to zero and disposal is costly, it impacts the lifetime ROI. Fortunately, the solar industry is fundamentally different from consumer electronics in terms of lifespan, degradation, and manufacturer responsibility.
Unlike a smartphone that is obsolete in a few years, solar panels are engineered for extreme durability. They are warrantied to perform for 25 to 30 years, and their output degrades very slowly and predictably. Data from SolarReviews shows that quality solar panels maintain 80-90% of their original efficiency even after 25 years of service. This means a panel is still a valuable energy-producing asset long after its initial payback period is met. It doesn’t become “e-waste” in the traditional sense; it becomes a less efficient but still functional generator.
Furthermore, the solar industry is increasingly focused on end-of-life management. While recycling infrastructure is still evolving, many top-tier manufacturers have implemented take-back and recycling programs. Companies like Renogy, for example, build their business model around providing a complete, integrated system, from panels to batteries and inverters, which fosters a greater sense of responsibility for the product’s entire lifecycle. This approach helps ensure that valuable materials like silver, copper, and silicon are recovered, diverting panels from landfills and feeding a circular economy.
The concern about e-waste is valid, but the comparison to disposable electronics is inaccurate. The longevity, slow degradation rate, and growing manufacturer take-back initiatives mean that solar panels represent a long-term infrastructure investment, not a short-term consumable. Their sustained energy production for decades ensures their financial value extends far beyond the initial payback calculation, and responsible end-of-life handling mitigates the environmental concerns.
How to Lower Your Utility Bill by 15% Using Smart Meter Data?
The final, and perhaps most crucial, step in a solar feasibility study happens before you ever get a quote: analyzing your own consumption. The most common mistake homeowners make is buying a solar system to power an inefficient home. The smarter, more cost-effective approach is to first reduce your energy needs, then size a smaller, cheaper solar system to meet that reduced demand. This directly shortens your payback period. Your smart meter is the tool that makes this possible.
Smart meters record your energy usage in 15-minute intervals. Most utilities provide a way for you to download this information, often called “Green Button Data.” This granular data is a roadmap to your home’s energy habits. When imported into a spreadsheet, it allows you to identify your “baseload” consumption—the energy your home uses 24/7, even when you think everything is turned off. This is caused by “phantom loads” from appliances in standby mode, old inefficient refrigerators, and other background electronics. Reducing this baseload is the fastest way to cut your energy bill.
A case study highlighted by Palmetto demonstrates this perfectly: a homeowner analyzed their smart meter data and discovered an inefficient freezer and several phantom loads were responsible for a constant 200W baseload. By replacing the freezer and eliminating the phantom loads, they were able to install a 1.5kW smaller solar system than originally quoted, saving $4,500 upfront and shortening their payback period by 2.5 years. This is a powerful testament to optimizing first and purchasing second. The data allows you to make targeted, high-impact efficiency upgrades that pay for themselves both in immediate bill reduction and in lower solar system costs.
By following a structured analysis of your own data, you can uncover significant savings and ensure you are buying only the solar capacity you truly need.
- Download Green Button Data: Access your utility’s online portal and download your 15-minute or hourly interval data for the past year.
- Create a Heat Map: Import the data into a spreadsheet and use conditional formatting to create an hourly usage heat map, visually identifying your peak consumption times.
- Identify Your Baseload: Find the minimum consumption level, typically occurring between 2 AM and 4 AM. This is your baseload; any value above a few dozen watts represents an opportunity for efficiency gains.
- Correlate Spikes with Usage: Look for sharp spikes in energy usage and correlate them with your daily routines. This helps identify which major appliances are your biggest energy consumers.
- Calculate Savings Potential: Model the financial impact of replacing an old appliance or shifting its usage time, calculating the annual savings on your utility bill and the reduced solar system size needed.
Your next step is to move from estimation to analysis. Start by downloading your smart meter data to establish a verifiable energy baseload and begin the process of optimizing your home for its most efficient energy future.