Most homebuyers mistakenly judge a property by its current traffic, only to be trapped by future gridlock. The key isn’t to visit during rush hour, but to conduct ‘traffic forensics’—proactively decoding city plans, spotting hidden congestion drivers like delivery routes, and understanding a neighborhood’s “congestion DNA.” This investigative approach allows you to secure a home that isn’t just convenient today, but remains a sanctuary from traffic for years to come.
The scene is painfully familiar. You’ve found the perfect house—great layout, good schools, a beautiful yard. You even did your due diligence, driving by during rush hour to check the commute. It seemed manageable. Yet, two years later, you’re spending an extra 30 minutes a day in bumper-to-bumper traffic because of a new development or a widened road you never saw coming. This is the homebuyer’s trap: evaluating a multi-decade investment with a single-day snapshot.
The conventional wisdom—to check Google Maps or visit at peak times—is dangerously incomplete. These methods only show you the traffic of today. They don’t account for the new shopping center planned two miles away, the “smart” traffic light system vulnerable to outages, or the relentless rise of delivery vans creating phantom traffic jams on quiet residential streets. The true challenge isn’t avoiding current traffic; it’s about predicting future flow.
But what if you could look into the future? The secret lies in shifting your mindset from a simple observer to a real estate location scout. The key isn’t just to see traffic, but to understand its underlying causes—its Congestion DNA. This guide will equip you with the foresight-driven tools to perform your own traffic forensics. We will decode city planning documents, reveal the hidden factors that mapping apps miss, and uncover how modern trends like remote work are fundamentally changing what makes a location truly valuable.
By learning to read the signs that others miss, you can move beyond guesswork. This article provides a structured approach to analyzing a property’s long-term traffic viability, ensuring the home you buy today remains the haven you intended it to be tomorrow.
Summary: How to Identify Future Traffic Nightmares Before Buying a House?
- Why Do Homes Near Roundabouts Appreciate Slower Than Cul-de-Sacs?
- How to Read City Zoning Maps to Spot Future Highway Expansions?
- Google Maps vs. Reality: Why Rush Hour Estimates Are Often Wrong?
- The Gridlock Scenario: What Happens When Smart Traffic Lights Lose Connection?
- Why Do 40% of Homebuyers Now Rate Internet Speed Above Proximity to Schools?
- Why Are Delivery Vans Responsible for 30% of Urban Congestion?
- Does Fiber Optic Internet Access Increase Your Home’s Resale Value?
- How to Shave 15 Minutes Off Your Commute by Leaving 10 Minutes Earlier?
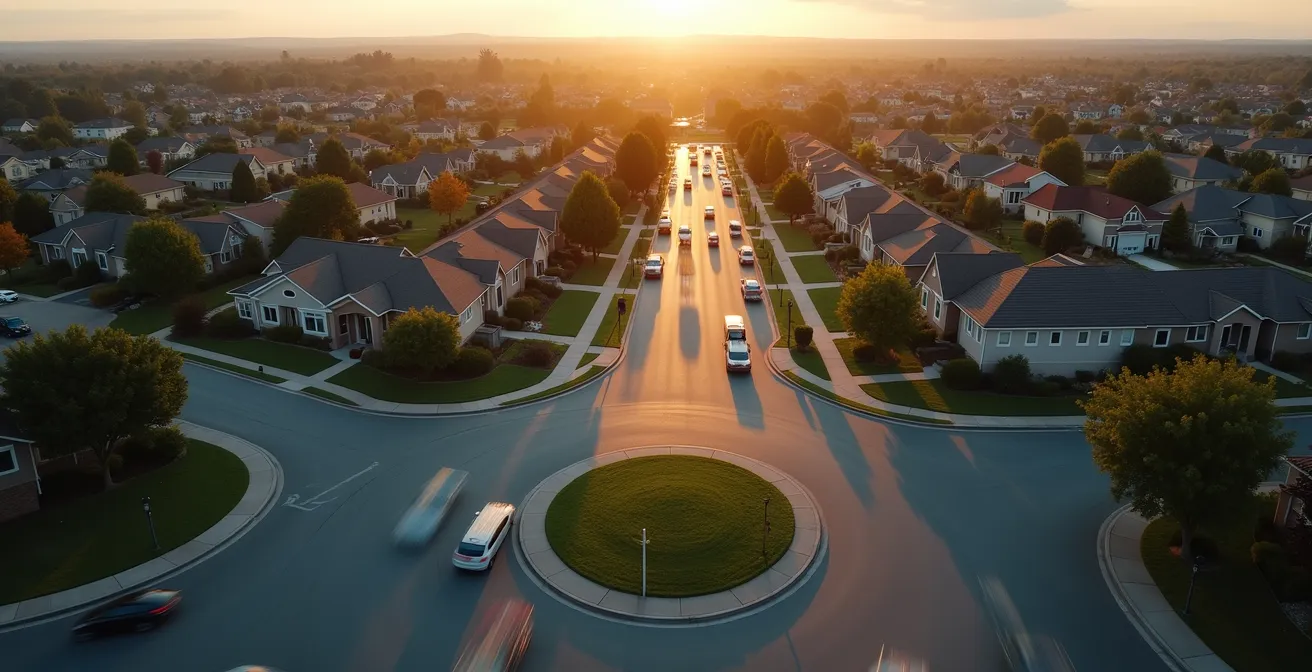
Why Do Homes Near Roundabouts Appreciate Slower Than Cul-de-Sacs?
The layout of your street is a fundamental part of your property’s Congestion DNA, with a direct and measurable impact on its value. While a quiet cul-de-sac often commands a premium, homes located near complex intersections like roundabouts can face a different financial reality. It’s not about the roundabout itself, but what it represents: a high-volume traffic funnel. Constant flow, even if it’s moving, introduces a baseline of noise and activity that is absent in a closed-end street. This subtle difference in living experience is reflected in the market.
Research consistently shows that buyers pay for tranquility. The perceived safety and seclusion of a cul-de-sac are tangible assets. In contrast, a home on a street that serves as a feeder for a roundabout is exposed to the entire neighborhood’s traffic. This exposure can be a significant drag on appreciation over time. Consider the “always traffic” phenomenon identified in congested cities like San Diego, where traffic is no longer confined to traditional rush hours. Homes near major arteries and intersections bear the brunt of this 24/7 flow, which can depress long-term value growth.
This isn’t just a feeling; it’s a financial calculation. While specific figures vary, the core principle holds: locations with predictable, high-volume traffic patterns tend to appreciate more slowly. The difference might seem small initially, but over the life of a 30-year mortgage, it can represent a significant amount of lost equity. Therefore, evaluating a street isn’t just about the home itself but about its role in the larger traffic ecosystem.
How to Read City Zoning Maps to Spot Future Highway Expansions?
The most significant traffic threats aren’t on the road today; they’re buried in municipal documents. To truly perform traffic forensics, you must learn to read city zoning maps and planning documents for clues about future construction. These documents are the blueprints for tomorrow’s congestion, and they are often publicly available online if you know where to look. They reveal the long-term intentions of city planners, far beyond what any real estate agent might disclose.
Your investigation should focus on identifying areas slated for growth. Look for unusually wide strips of land designated as “Public Utility Easements” or areas zoned for “Transportation Corridor Overlay.” These are often placeholders for future road widening projects or even new highways. They signal that the quiet two-lane road behind your potential dream home could become a four-lane thoroughfare in five to ten years. By cross-referencing these maps with your city’s Capital Improvement Plan (CIP), you can see which projects are not just planned, but funded and scheduled.

As this image illustrates, the key is in the details. A magnifying glass approach is necessary. You should also review the minutes from recent Planning Commission meetings, searching for keywords like “traffic study,” “right-of-way acquisition,” or the specific name of a major street near your target property. These records provide a real-time window into the discussions and decisions that will shape your future commute.
Your Action Plan: 5 Steps to Identify Future Traffic Projects
- Access your city’s Capital Improvement Plan (CIP) documents online to reveal funded road projects 5-10 years in advance.
- Search for Transportation Improvement Programs (TIPs) on your state’s Department of Transportation (DOT) website for a regional overview.
- Look for unusually wide ‘Public Utility Easements’ on zoning maps, which are often placeholders for road widening.
- Review Planning Commission meeting minutes using keywords like ‘traffic study’ or ‘right-of-way acquisition’ to find early-stage discussions.
- Check for ‘Transportation Corridor Overlay’ districts on zoning maps, as these signal long-term expansion plans.
Google Maps vs. Reality: Why Rush Hour Estimates Are Often Wrong?
Relying solely on Google Maps for traffic analysis is like trying to predict a hurricane with a weather vane. It tells you what’s happening now, but offers little insight into the systemic pressures building just over the horizon. Digital mapping tools are excellent for real-time navigation, but their “typical traffic” estimates are based on historical data that often fails to capture the full, nuanced picture of a modern commute, where the average American now spends 63 hours per year stuck in traffic.
These algorithms are flawed for several reasons. First, they average data over time, smoothing out the sharp, sudden spikes in congestion that define the worst commute experiences. A 45-minute average commute can easily hide the reality of a twice-weekly 75-minute gridlock nightmare. Second, they are slow to adapt to new patterns, like the mid-day chaos caused by an explosion in home deliveries. Finally, they don’t account for the human factor—the aggressive driving and higher crash risks that come with peak congestion.
A more analytical approach involves understanding the specific characteristics of peak traffic in your target area. Different days and times have vastly different traffic profiles, a complexity that a simple “red line” on a map cannot convey.
| Time Period | Traffic Volume | Crash Risk |
|---|---|---|
| Morning (6-9 AM) | 62.54% of daily traffic | Higher risk |
| Evening (4-7 PM) | Heavy congestion | 8.5% aggressive driving crashes |
| Thursday | Heaviest weekday traffic | Peak congestion |
| Monday | Lightest weekday traffic | Lower risk |
As the data shows, not all rush hours are created equal. Thursday evening’s commute is a fundamentally different beast from Monday morning’s. To truly understand a potential commute, you must move beyond the app and analyze these underlying patterns, preferably with several real-world test drives at the most notorious times.
The Gridlock Scenario: What Happens When Smart Traffic Lights Lose Connection?
In the quest for urban efficiency, many cities are adopting “smart” infrastructure, including interconnected traffic light systems designed to optimize flow. These systems promise a future of smoother commutes by analyzing data in real time. However, this increased complexity introduces a new and often overlooked vulnerability: the risk of systemic failure. When these highly optimized networks go down, they don’t just fail—they create cascading gridlock on a scale far worse than any normal traffic jam.
This is the “Gridlock Scenario,” a modern traffic nightmare that prospective homebuyers should consider. A centralized system represents a single point of failure. A server crash, a cyber-attack, or even a simple loss of network connectivity can cause the entire system to default to a failsafe mode. In most cases, this means every single traffic light at every intersection starts flashing red, effectively turning the entire grid into a massive, dysfunctional four-way stop.
Case Study: The Smart City System Failure
Cities using advanced traffic management systems, like those developed by Cisco, demonstrate both the potential and the peril of this technology. These systems analyze millions of data points to dynamically adjust signal timing. However, when these interconnected systems experience a failure, the result is catastrophic. Reports from municipalities with these systems show that a system-wide outage can increase congestion by as much as 200% as all signals default to a flashing red, creating instant and widespread gridlock.
This highlights a critical paradox of modern infrastructure. As an NPR transportation analysis pointed out, the more we optimize, the more fragile the system can become.
The more interconnected and optimized a city’s infrastructure becomes, the more vulnerable it is to a single point of systemic failure.
– NPR Transportation Analysis, NPR Traffic Congestion Report
Before buying into a “smart” city, an insightful homebuyer should ask a crucial question: What is the system’s failsafe protocol, and how resilient is it to a total network failure? The answer could determine whether your future commute is smooth or stranded.
Why Do 40% of Homebuyers Now Rate Internet Speed Above Proximity to Schools?
The definition of a “prime location” is undergoing a seismic shift, driven by the rise of remote work. For a growing segment of the population, the daily commute is no longer a drive to the office, but a walk to the spare bedroom. In this new reality, the most important highway is the information highway. Consequently, the quality of a home’s internet connection has become a top-tier consideration, in some cases eclipsing traditional factors like school districts.
This isn’t a niche trend. With over 40% of Americans now working remotely full-time or part-time, a stable, high-speed internet connection is no longer a luxury; it’s essential infrastructure. A home without fiber optic access is, for many professionals, the equivalent of a home with a one-hour commute. This shift in priorities is dramatically reshaping the real estate market, making digital access a critical component of a property’s long-term viability and value.
The data is unambiguous. Buyers are explicitly prioritizing connectivity, and it’s influencing their decisions on a massive scale. As the Fiber Broadband Association noted in a recent study, the hierarchy of home amenities has been rewritten.
U.S. consumers rated high-quality broadband as the second most important amenity in a home, just after a laundry room.
– Fiber Broadband Association, 2023 Consumer Research Study
For a homebuyer conducting traffic forensics, this means the investigation must extend to the digital realm. A home in an area with heavy physical traffic might still be a brilliant investment if it offers best-in-class fiber internet, effectively “commute-proofing” it for the modern workforce. Verifying the availability and quality of internet service is now as crucial as checking for traffic at rush hour.
Why Are Delivery Vans Responsible for 30% of Urban Congestion?
One of the most significant and misunderstood drivers of modern congestion is the explosion of e-commerce. Every online order translates into a delivery vehicle on the road, and these vans are creating a new kind of gridlock: the “phantom traffic jam.” This phenomenon, responsible for a substantial portion of urban congestion, is nearly invisible to standard traffic analyses but has a profound impact on residential quality of life. Unlike commuter traffic, which follows predictable patterns, delivery traffic is constant and chaotic.
The problem stems from a lack of infrastructure. Most residential streets were not designed for commercial loading and unloading. When a delivery van double-parks on a narrow street, it forces every car behind it to merge into a single lane. This single maneuver creates a ripple effect, a shockwave of braking and slowing that can extend for several blocks. In high-density areas, a steady stream of these vehicles creates a state of perpetual, low-level congestion that clogs local arteries and makes neighborhood travel a frustrating ordeal.
The impact is stark in major urban centers. In Greater Los Angeles, where the average commuter lost 137 hours to traffic in 2024, studies found that commercial truck and van traffic is a primary culprit. These vehicles create constant disruptions that traditional traffic models, focused on commuter flow, fail to capture. Before buying a home, it’s vital to assess the potential impact of delivery traffic. Visit the neighborhood during the “mid-day mayhem” hours (10 AM to 4 PM) and observe. Is there a constant parade of Amazon, FedEx, and UPS vans? Are there designated loading zones, or is double-parking the norm? The answers will reveal a hidden layer of the area’s Congestion DNA.
Does Fiber Optic Internet Access Increase Your Home’s Resale Value?
The answer is an emphatic yes. In the modern real estate market, access to fiber optic internet is no longer just an amenity; it’s a core feature that directly and measurably increases a home’s resale value. As remote work becomes a permanent fixture of the economy, a home’s ability to function as a reliable workplace is a primary value driver. A property with a gigabit fiber connection is fundamentally more valuable than an identical one without it.
This isn’t speculation; it’s backed by hard data. Research from the Fiber Broadband Association shows a clear correlation between fiber availability and property valuation. For a typical single-family home, having a fiber connection can add thousands of dollars to its sale price. This “fiber premium” acts as a powerful financial buffer, making a home a more resilient and profitable long-term investment. In essence, investing in a home with fiber is a way to “commute-proof” your asset, ensuring its relevance and appeal to a wide pool of future buyers.
The financial impact varies by property type but is consistently positive across the board. Homes without fiber are not just missing a feature; they are actively penalized in the market, often seeing a reduction in value compared to their connected neighbors.
| Property Type | Price Reduction Without Fiber | Value Increase With Fiber |
|---|---|---|
| Single-Family Home | -4.9% | +$15,500 (on $300K home) |
| Condo | -3.2% | +$9,600 (on $300K condo) |
| Rental Apartment | -12.8% rent | +12.8% rental income |
The aggregate effect is enormous, with one analysis projecting that the value added to the housing market by fiber will exceed $36 billion. For an individual homebuyer, the lesson is clear: verifying fiber access is a critical step in financial due diligence, as vital as a home inspection. It’s a feature that pays for itself, both in daily quality of life and at the closing table.
Key takeaways
- Move beyond simple observation; true due diligence requires ‘traffic forensics’ to predict future congestion.
- City planning documents, not Google Maps, are the most reliable source for forecasting long-term traffic changes.
- Modern congestion is driven by hidden factors like delivery van routes and the fragility of ‘smart’ infrastructure.
How to Shave 15 Minutes Off Your Commute by Leaving 10 Minutes Earlier?
After conducting a thorough traffic forensics investigation, you may still choose a home in an area with some level of unavoidable congestion. However, even in this scenario, strategic thinking can reclaim a significant amount of your time and sanity. The key is to understand the concept of the “bottleneck saturation point”—the precise moment when a trickle of cars becomes a gridlocked mass. Beating this tipping point, often by just a few minutes, can have a disproportionately large impact on your travel time.
Traffic doesn’t build linearly; it builds exponentially. The first 10 minutes of rush hour might add only five minutes to a commute, but the next 10 minutes could add another 15. Research shows that leaving 30-60 minutes earlier than peak times can reduce commute times by 20-30%. The sweet spot, however, is often much smaller. By identifying the exact moment congestion sets in on your route, you can plan to pass through major choke points like bridges and merges just before they hit capacity. Leaving just 10 minutes earlier can mean you miss the wave, saving you 15 or 20 minutes on the other side.

As the visual contrast between free-flowing and congested traffic shows, timing is everything. To find your optimal departure time, use Google Maps’ “Arrive by” feature for several consecutive days to pinpoint when the congestion threshold is crossed. Test different departure times and log your actual travel time. This data-driven approach allows you to master your environment rather than being a victim of it. It’s the final layer of control in securing a home and a lifestyle that works for you, not against you.
Ultimately, a successful home purchase is about foresight. By applying these investigative techniques—from decoding zoning maps to timing your test drives with precision—you empower yourself to make a decision based not on a snapshot, but on a forecast. Start applying these traffic forensics principles to your property search today to secure a home that promises not just a roof over your head, but a clear road ahead.